Quantum Modeling
Redlined: The Math of Systemic Collapse
"Overworked and underpaid doesn't even begin to touch it."
We have all felt the difference between a busy season and a systemic redline. It is the exhaustion that does not lift after the weekend, the sense that no matter how much we optimize, the finish line keeps moving. For a long time, we were told this was just the nature of the work.
I wanted to move beyond speculation and see if these experiences held up under objective scrutiny. I ran a structural audit using a diagnostic engine I have developed called Minrva. In the office, we sometimes refer to her as The Oracle. She was originally designed to support franchise operations serving their local communities, but the principles of systemic health I built into her are universal, and I have scaled her diagnostic reach to a global level for the Human Cost project.
I did not do this to speculate. I did it to move the conversation from how we feel to what the data says. To anchor this analysis, I integrated the Global Supply Chain Pressure Index, using it as our primary diagnostic signal to measure system-wide stress.
The Snap Point: Why Logistics Data Matters
The index is traditionally used to measure bottlenecks in global manufacturing and logistics. But the physics of a system are universal: whether it is a shipping port, a community-based franchise, or a corporate organization, a system run at 100 percent capacity will fracture.
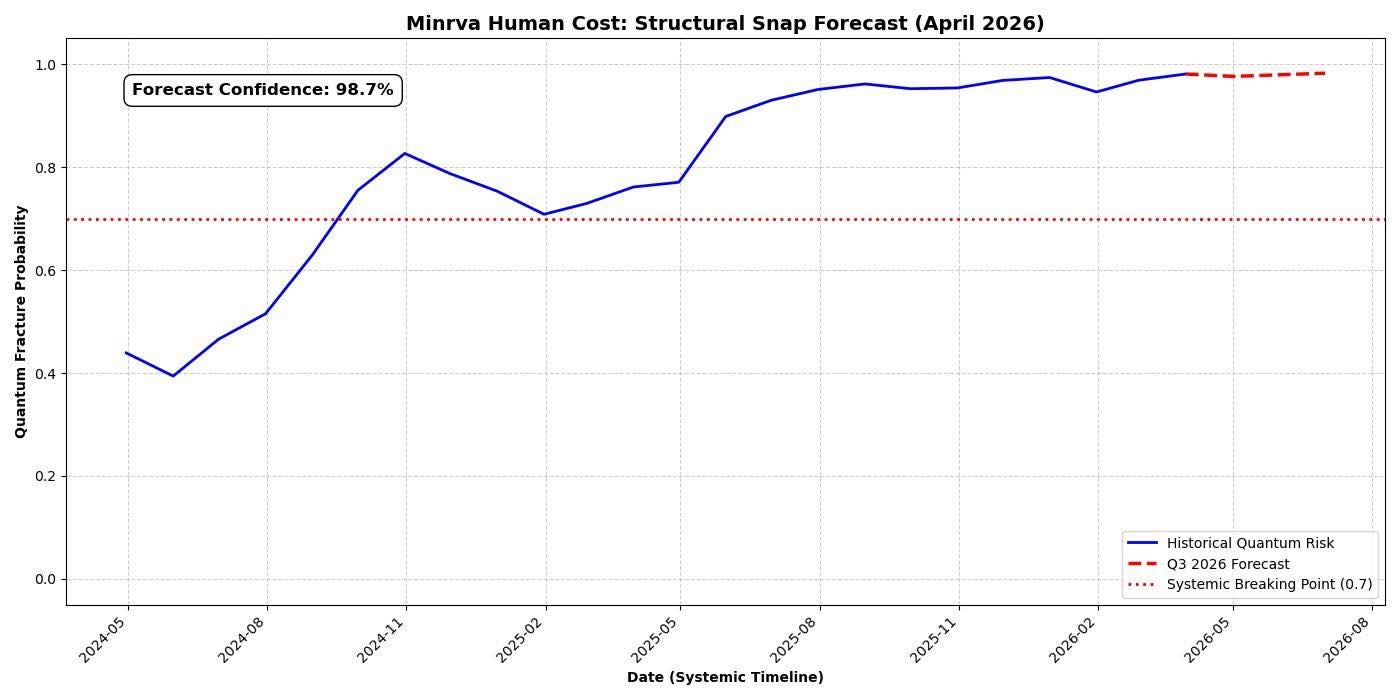
Look at the red dotted line at 0.7. That is the Systemic Breaking Point. When we cross that line, we stop being a high-functioning team and start operating in a state of 100 percent saturation.
Saturation is the difference between a car designed to cruise at 60mph and one being forced to hold 100mph indefinitely. When you force an engine to run at 100mph, when it was engineered for 60, you are not just going fast. You are violating the engineering parameters of the machine. The oil breaks down, the cooling system loses its ability to manage the heat, and the components begin to stress-fracture. You do not have a faster car; you have an engine waiting for an excuse to explode. Right now, most industries are barely holding at 100mph. We are not being high performers; we are being forced to operate outside the physical limits of our design.
The Minrva Logic
Minrva diagnostic capability is not just standard data crunching; it is built on quantum entanglement and superposition modeling. Unlike traditional tools that look at individual variables in isolation, Minrva treats the entire organization as an entangled system, where a change in one pressure point causes an immediate, non-linear ripple effect across the whole.
To make this possible, Minrva interacts with IBM Fez quantum processor using a specialized interface that communicates in the hardware's native quantum language. By bypassing the translation lag of classical computers, she can directly map our workflow complexity onto the processor architecture.
This allows her to utilize superposition to map every potential stress scenario simultaneously rather than testing them one by one. While a classical system struggles to calculate outcomes in sequence, "The Oracle" evaluates the entire landscape of risk at once. She identifies the exact resonance frequency where our system snaps, visualizing the hidden tension that standard tools are blind to. It is a proprietary method that translates massive, entangled data sets into a clear, actionable fracture forecast.
The Predictive Power
By integrating the Index with our own operational data, Minrva acts as a predictive diagnostic tool. We are not just reacting to the gut feeling of burnout; we are seeing the fracture trajectory months before it arrives.
This model allows us to quantify the buffer, meaning we can calculate exactly how much slack is needed to bring the system back to a sustainable 60mph cruise. We can forecast stability, moving from reactive firefighting to proactive architectural adjustments. We can identify the structural ceiling, proving mathematically that the current design, not our work ethic, is the primary constraint on output.
The Bottom Line
The forecast shown in the red dashed line is not a prediction of our productivity; it is a prediction of an impending mechanical breakdown.
This data proves that the current pace is not a reflection of our effort; it is a reflection of a system that has outpaced its own design. It is time to move the conversation from opinion to evidence and use these predictive tools to adjust our architecture before the fracture happens.
